IBM redesigned its business intelligence platform, now called IBM Cognos Analytics. Expected to be released by the end of 2015, the new version includes features to help end users model their own data without IT assistance while maintaining the centralized governance and security that the platform already has. Our benchmark research into information optimization shows that simplifying access to information is important to vr_Info_Optimization_01_whos_responsible_for_information_availabilityvirtually all (97%) participating organizations, but it also finds that only one in four (25%) are satisfied with their current software for doing that. Simplification is a major theme of the IBM Cognos redesign.

The new IBM Cognos Analytics provides a completely Web-based environment that is consistent in the user interface and security across multiple devices and browsers. The redesigned interface follows IBM’s internal cultural shift to base product development first on the user experience and second on features and functionality. This may be a wise move as our research across multiple analytic software categories finds usability to be organizations’ most often important buying criterion.

The redesign is based on the same design and self-service principles as IBM Watson Analytics which we did award a Ventana Research Technology Innovation Award for 2015 in business analytics. The redesign is most evident in the IBM Cognos Analytics authoring mode. The Report Studio and Cognos Workspace Advanced modules have been replaced with a simplified Web-based modeling environment. The extended capabilities of IBM Cognos 10.2.2 are still available, but now they are hidden and more logically arranged to provide easier user access. For example, the previous version of Cognos presented an intimidating display of tools with which to do tasks such as fine-grain manipulation of reports; now these features are hidden but still easily accessible. If a user is having difficulty finding a particular function, a “smart search” feature helps to find the correct menu to add it.

The new system indexes objects, including metadata, as they are created, providing a more robust search function suitable for nontechnical users in the lines of business. The search feature works with what IBM calls “intent-based modeling” so users can search for words or phrases – for example, revenue by unit or product costs – and be presented with only relevant tables and columns. The system can then automatically build a model by inferring relationships in the data. The result is that the person building the report need not manually design a multidimensional model of the data, so less skilled end users can serve themselves to build their own data models that underpin dashboards and reports. Previously, end users were limited to parameterized reporting in which they could work only within the context of models previously designed by IT. Many vendors of analytics have been late in exploiting the power of search and therefore may be missing a critical feature that customers desire. Ventana Research is a proponent of such capabilities; my colleague Mark Smith has written about them in the context of data discovery technology. Search is fundamental to user-friendly discovery systems, as is reflected in the success of companies such as Google and Splunk. With search becoming more sophisticated, being based on machine-learning algorithms, we expect it to become a key requirement for new analytics and business intelligence systems.

Furthering the self-service aspect is the ability for end users to access and combine multiple data sets. The previous version of IBM Cognos (10.2.2) allowed users to work with “personal data sets” such as .csv files, but they needed an IBM DB2 back end to house the files. Now such data sets can be uploaded and managed directly on the IBM Cognos Analytics server and accessed with the new Web-based authoring tool. Once data sets are uploaded they can be accessed and modeled like any other object to which the user has access. In this way, IBM Cognos Analytics addresses the “bring your own data” challenge in which data sources such as personal spreadsheets must be integrated into enterprise analytics and business intelligence systems.

After modeling the data, users can lay out new dashboards using drag-and-drop capabilities like those found in IBM Watson Analytics. Dashboards can be previewed and put into service for one-time use or put into production mode if the user has such privileges. As is the case with IBM Watson Analytics, newly designed dashboard components such as tables, charts and maps are automatically linked so that changes in one part of the dashboard automatically relate to other parts. This feature facilitates ease of use in designing dashboards. Some other tools in the market require widgets to be connected manually, which can be time-consuming and is an impediment to prototyping of dashboards.

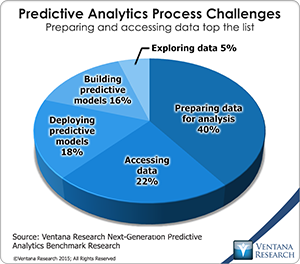
The move to a more self-service orientation has long been in the works for IBM Cognos and so this release is an important one for IBM. The ability to automatically integrate and model data gives the IT department a more defensible position as other self-service tools are introduced into the organization and are challenging data access and preparation built within tools like IBM Cognos. vr_DAC_20_justification_for_data_preparation
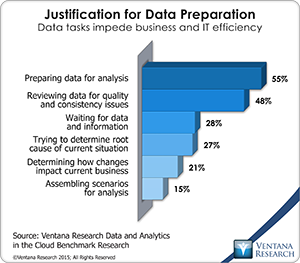
This is becoming especially important as the number and complexity of data sources increases and are needed more rapidly by business. Our research into information optimization shows that most organizations need to integrate at least six data sources and some have 20 or more sources they need to bring together. All of which confirms what our data and analytics in the cloud benchmark research finds data preparation to be a top priority in over half (55%) of organizations.

Over time, IBM intends to integrate the capabilities of Cognos Analytics with those of Watson Analytics. This is an important plan because IBM Watson Analytics has capabilities beyond those of self-service tools in the market today. In particular, the ability to explore unknown data relationships and do advanced analysis is a key differentiator for IBM Watson Analytics, as I have written. IBM Watson Analytics enables users to explore relationships in data that otherwise would not be noticeable, whereas IBM Cognos Analytics enables them to explore and put into production information based on predefined assumptions.

Going forward, I will be watching how IBM aligns Cognos Analytics with Watson Analytics, and in particular, how Cognos Analytics will fit into the IBM cloud ecosystem. Currently IBM Cognos Analytics is offered both on-premises and in a hosted cloud, but here also IBM is working to align it VR_AnalyticsandBI_VI_HotVendor_2015more closely with IBM Watson Analytics. Bringing in data preparation, data quality and MDM capabilities from the IBM DataWorks product could also benefit IBM Cognos Analytics users. IBM should emphasize the breadth of its portfolio of products including IBM Cognos TM1, IBM SPSS, IBM Watson Analytics and IBM DataWorks as it faces stiff competition in enterprise analytics and business intelligence from a host of analytics companies including new cloud-based ones. IBM is rated a Hot Vendor in our Ventana Research Analytics and Business Intelligence Value Index in part because of its overall portfolio.

For organizations already using IBM Cognos, the redesign addresses the need of end users to create their own dashboards while maintaining IT governance and control. The new interface may take some getting used to, but it is modern and more intuitive than previously. For companies new to IBM Cognos, as well as departments wanting to take a look at the platform, cloud options offer less risk. For those wanting early access to the new IBM Cognos Analytics, IBM has provided access to it on www.analyticszone.com. The changes I have noted move IBM Cognos Analytics closer to the advances in analytics as a whole, and I recommend that all these groups examine the new version.

Regards,

Ventana Research

Tableau Software’s annual conference, which company spokespeople reported had more than 10,000 attendees, filled the MGM Grand in Las Vegas. Various product announcements supported the company’s strategy to deliver value to analysts and users of visualization tools. Advances include new data preparation and integration features, advanced analytics and mapping. The company also announced the release of a stand-alone mobile application called Vizable . One key message management aimed to promote is that Tableau is more than just a visualization company.

Over the last few years Tableau has made strides in the analytics and business intelligence market with a user-centric philosophy and the ability to engage younger analysts who work in the lines of business rather than in IT. Usability continues to rank as the top criteria for selecting analytic and business intelligence software in all of our business analytics benchmark research. In this area Tableau has introduced innovations such as VizQL, originally developed at Stanford University, which links capabilities to query a database and to visualize data. This combination enables users not highly skilled in languages such as SQL or using proprietary business intelligence tools to create and share visually intuitive dashboards. The effect is to provide previously unavailable visibility into areas of their operations. The impact of being able to see and compare performance across operations and people often increases communication and knowledge sharing.

Tableau 9, released in April 2015, which I discussed, introduced advances including analytic ease of use and performance, new APIs, data preparation, storyboarding and Project Elastic, the precursor to this year’s announcement of Vizable. Adoption of 9.x appears to be robust given both the number of conference attendees and increases in third-quarter revenue ($170 million) and new customers (3,100) reported to the financial markets.

As was the case last year, conference announcements included some developments already on the market as well as some still to come. Among data preparation capabilities introduced are integration and automated spreadsheet cleanup. For the former, being able to join two data sets through a union function, which adds rows to form a single data set, and to do integration across databases by joining specific data fields gives users flexibility in combining, analyzing and visualizing multiple sets of data. For the latter, to automate the spreadsheet cleanup process Tableau examined usage patterns of Tableau Public to learn how users manually clean their spreadsheets. Then it used machine-learning algorithms to help users automate the tasks. Being able to automatically scan Excel files to find subtables and automatically transform data without manual calculations and parsing will save time for analysts who vr_LA_most_important_location_analytics_capabilitiesotherwise would have to do these tasks manually. Our benchmark research into information optimization shows that data preparation consumes the largest portion of time spent on analytics by nearly half (47%) of organizations and even higher in our latest data and analytics in the cloud benchmark research by 59 percent of organizations.

Advanced analytics is another area of innovation for Tableau. The company demonstrated developments in outlier detection and clustering analysis natively integrated with the software. Use of these features is straightforward and visually oriented, replacing the need for statistical charts with drag-and-drop manipulation. The software does not enable users to identify numbers of segments or filter the degree of the outliers, but the basic capability can reduce data sets to more manageable analytic sets and facilitate exploration of anomalous data points within large sets. The skill necessary for these tasks, unlike the interpretation of box plots introduced at last year’s conference, is more intuitive and better suited for business users of information.

The company also demonstrated new mapping and geospatial features at the conference. Capabilities to analyze down to the zip code on a global basis, define custom territories, support geospatial files, integrate with vr_LA_most_important_location_analytics_capabilitiesthe open source mapping platform MapBox and perform calculations within the context of a digital map are all useful features for location analytics, which is becoming more important in areas such as customer analytics and digital devices connected in the emerging Internet of things (IoT). Tableau is adding capabilities that participants most often cited as important in our research on location analytics: to provide geographic representation (72%), visualize metrics associated with locations (65%) and directly select and analyze locations on maps (61%).

Tableau insists that its development of new capabilities is guided by customer requests. This provides a source of opportunities to address user needs especially in the areas of data preparation, advanced analytics and location analytics. However, this strategy raises the question of whether it will ultimately put the company in conflict with the partners that have helped build the Tableau ecosystem and feed the momentum of the company thus far. Tableau is positioning its product as a fully featured analytic platform of the sort that I have outlined, but to achieve that eventually it will have to encroach on the capabilities that partners such as Alteryx, Datawatch, Informatica, Lavastorm, Paxata and Trifacta offer today. Another question is whether Tableau will continue its internal development strategy or opt to acquire companies that can broaden its capabilities that has hampered its overall value rating as identified in our 2015 Analytics and Business intelligence Value Index. In light of announcements at the conference, the path seems to be to develop these capabilities in-house. While there appears to be no immediate threat to the partnerships the continuation of development of some of these capabilities eventually will impact the partner business model in a more material way. Given that the majority of the deals for its partner ecosystem flows through Tableau itself, many of the partners are vulnerable to these development efforts. In addition I will be watching how aggressively Tableau helps to market Spark, the open source big data technology that I wrote about, as compared to some of the partner technologies that Spark threatens. Tableau has already built on Spark while some of its competitors have not, which may give Tableau a window of opportunity.

Going forward, integration with transactional systems and emerging cloud ecosystems is an area for Tableau that I will be watching. Given its architecture it’s not easy for Tableau to participate in the new generation of service-oriented architectures that characterize part of today’s cloud marketplace. For this reason, Tableau will need to continue to build out its own platform and the momentum of its ecosystem – which at this point does not appear to be a problem.

Finally, it will be interesting to see how Tableau eventually aligns its stand-alone data visualization application Vizable with its broader mobile strategy. We will be looking closely at the mobile market in our upcoming Mobile Analytics and Business Intelligence Value Index in the first half of 2016 where in our last analysis found Tableau was in the middle of the pack with other providers but they have made more investments since our last analysis.

We recommend that companies exploring analytics platforms, especially for on-premises and hosted cloud use, include Tableau on their short lists. Organizations that consider deploying Tableau on an enterprise basis should look closely at how it aligns with their broader user requirements and if their cloud strategy will meet its future needs. Furthermore, while the company has made improvements in manageability and performance, these can still be a concern in some circumstances. Tableau should be evaluated also with specific business objectives in mind and in conjunction with its partner ecosystem.

Regards,

Ventana Research

PentahoWorld 2015, Pentaho’s second annual user conference, held in mid-October, centered on the general availability of release 6.0 of its data integration and analytics platform and its acquisition by Hitachi Data Systems (HDS) earlier this year. Company spokespeople detailed the development of the product in relation to the roadmap laid out in 2014 and outlined plans for its integration with those of HDS and its parent Hitachi. They also discussed Pentaho’s and HDS’s shared intentions regarding the Internet of Things (IoT), particularly in telecommunications, healthcare, public infrastructure and IT analytics.

Pentaho competes on the basis of what it calls a “streamlined data refinery” that enables a flexible way to access, transform and integrate data and embed and present analytic data sets in usable formats without writing new code. In addition, it integrates a visual analytic workflow interface with a business intelligence front end including customization extensions; this is a differentiator for the company since much of the self-serve analytics market in which it competes is still dominated by separate point products.

Pentaho 6 aims to provide manageable and scalable self-service analytics. A key advance in the new version is what Pentaho calls “virtualized data sets” that logically aggregate multiple data sets according to transformations and integration specified by the Pentaho Data Integration (PDI) analytic workflow interface. This virtual approach allows the physical processing to be executed close to the data in various systems such as Hadoop or an RDBMS, which relieves users of the burden of having to continually move data back and forth between the vr_oi_factors_impeding_ol_implementationquery and the response systems. In this way, logical data sets can be served up for consumption in Pentaho Analytics as well as other front-end interfaces in a timely and flexible manner.

One challenge that emerges when accessing multiple integrated and transformed data sets is data lineage. Tracking its lineage is important to establish trust in the data among users by enabling them to ascertain the origin of data prior to transformation and integration. This is particularly useful in regulated industries that may need access to and tracking of source data to prove compliance. This becomes even more complicated with events and completely sourcing them along with the large number of them as found in over a third of organizations in our operational intelligence benchmark research that examined operational centric analytics and business intelligence.

Similarly, Pentaho 6 uses Simple Network Management Protocol (SNMP) to deliver application programming interface (API) extensions so that third-party tools can help provide governance lower in the system stack to further enable reliability of data. Our benchmark research consistently shows that manageability of systems is important for user organizations and in particular for big data environments.

The flexibility introduced with virtual tables and improvements in Pentaho 6.0 around in-line modeling (a concept I discussed after last year’s event are two critical means to building self-service analytic environments. Marrying various data systems with different data models, sometimes referred to as big data integration, has proven to be a difficult challenge in such environments. Pentaho’s continued focus on vr_BDI_01_automating_big_data_integrationbig data integration and providing an integration backbone to the many business intelligence tools (in addition to its own) are potential competitive differentiators for the company. While analysts and users prefer integrated tool sets, today’s fragmented analytics market is increasingly dominated by separate tools that prepare data and surface data for consumption. Front-end tools alone cannot automate the big data integration process, which Pentaho PDI can do.Our research into big data integration shows the importance of eliminating manual tasks in this process: 78 percent of companies said it is important or very important to automate their big data integration processes. Pentaho’s ability to integrate with multiple visual analytics tools is important for the company, especially in light of the HDS accounts, which likely have a variety of front-end tools. In addition, the ability to provide an integrated front end can be attractive to independent software vendors, analytics services providers and certain end-user organizations that would like to embed both integration and visualization without having to license multiple products.

Going forward, Pentaho is focused on joint opportunities with HDS such as the emerging Internet of Things. Pentaho cites established industrial customers such as Halliburton, Intelligent Mechatonic Systems and Kirchoff Datensysteme Software as reference accounts for IoT. In addition, a conference participant from Caterpillar Marine Asset Intelligence shared how it embeds Pentaho to help analyze and predict equipment failure on maritime equipment. Pentaho’s ability to integrate and analyze multiple data sources is key to delivering business value in each of these environments, but the company also possesses a little-known asset in the Weka machine learning library, which is an integrated part of the product suite. Our research on next-generation predictive analytics finds that Weka is used by 5 percent of organizations, and many of the companies that use it are large or very large, which is Pentaho’s target market. Given the importance of machine learning in the IoT category, it will be interesting to see how Pentaho leverages this asset.

Also at the conference, an HDS spokesperson discussed its target markets for IoT or what the company calls “social innovation.” These markets include telecommunications, healthcare, public infrastructure and IT analytics and reflect HDS’s customer base and the core businesses of its parent company Hitachi. Pentaho Data Integration is currently embedded within major customer environments such as Caterpillar, CERN, FINRA, Halliburton, NASDAQ, Sears and Staples, but not all of these companies fit directly into the IoT segments HDS outlined. While Hitachi’s core businesses provide a fertile ground in which grow its business, Pentaho will need to develop integration with the large industrial control systems already in place in those organizations.

The integration of Pentaho into HDS is a key priority. The 2,000-strong global sales force of HDS is now incented to sell Pentaho, and it will be important for the reps to include it as they discuss their accounts’ needs. While Pentaho’s portfolio can potentially broaden sales opportunities for HDS, big data software is a more consultative sale than the price-driven hardware and systems that the sales force may be used to. Furthermore, the buying centers, which are shifting from IT to lines of business, can be significantly different based on the type of organization and their objectives. To address this will require significant training within the HDS sales force and with partner consulting channels. The joint sales efforts will be well served by emphasizing the “big data blueprints” developed by Pentaho over the last couple of years and developing of new ones that speak to IoT and the combined capabilities of the two companies.

HDS says it will begin to embed Pentaho into its product portfolio but has promised to leave Pentaho’s roadmap intact. This is important because Pentaho has done a good job of listening to its customers and addressing the complexities that exist in big data and open source environments. As the next chapter unfolds, I will be looking at how the company integrates its platform with the HDS portfolio and expands it to deal with the complexities of IoT, which we will be investigating in upcoming benchmark research study.

For organizations that need to use large-scale integrated data sets, Pentaho provides one of the most flexible yet mature tools in the market, and they should consider it. The analytics tool provides an integrated and embeddable front end that should be of particular interest to analytics services providers and independent software vendors seeking to make information management and data analytics core capabilities. For existing HDS customers, the Pentaho portfolio will open conversations in new areas of those organizations and potentially add considerable value within accounts.

Regards,

Ventana Research

The emerging Internet of Things (IoT) extends digital connectivity to devices and sensors in homes, businesses, vehicles and potentially almost anywhere. This innovation enables devices designed for it to generate and transmit data about their operations; analytics using this data can facilitate monitoring and a range of automatic functions.vr_oi_goals_of_using_operational_intelligence_updated

To perform these functions IoT requires what Ventana Research calls Operational Intelligence (OI), a discipline that has evolved from the capture and analysis of instrumentation, networking and machine-to-machine interactions of many types. We define operational intelligence as a set of event-centered information and analytic processes operating across an organization that enable people to use that event information to take effective actions and make optimal decisions. Our benchmark research into Operational Intelligence shows that organizations most often want to use such event-centric architectures for defining metrics (37%) and assigning thresholds for alerts (35%) and for more action-oriented processes of sending notifications to users (33%) and linking events to activities (27%).

In many industries, organizations can gain competitive advantage if they can reduce the elapsed time between an event occurring and actions taken or decisions made in response to it. Existing business intelligence (BI) tools provide useful analysis of and reporting on data drawn from previously recorded transactions, but to improve competitiveness and maximize efficiencies organizations are concluding that employees and processes – in IT, business operations and front-line customer sales, service and support – also need to be able to detect and respond to events as they happen. Our research into big data integration shows that nearly one in four companies currently integrate data into big data stores in real time. The challenge is to go further and act upon both the data that is stored and the data that is streaming in a timely manner.

The evolution of operational intelligence, especially in conjunction with IoT, is encouraging companies to revisit their priorities and spending for information technology and application management. However, sorting out the range of options poses a challenge for both business and IT leaders. Some see potential value in expanding their network infrastructure to support OI. Others are implementing event processing (EP) systems that employ new technology to detect meaningful patterns, anomalies and relationships among events. Increasingly, organizations are using dashboards, visualization and modeling to notify nontechnical people of events and enable them to understand their significance and take appropriate and immediate action.

As with any innovation, using OI for IoT may require substantial changes. These are among the challenges organizations face as they consider adopting operational intelligence:

  • They find it difficult to evaluate the business value of enabling real-time sensing of data and event streams using identification tags, agents and other systems embedded not only in physical locations like warehouses but also in business processes, networks, mobile devices, data appliances and other technologies.
  • They lack an IT architecture that can support and integrate these systems as the volume and frequency of information increase.
  • They are uncertain how to set reasonable business and IT expectations, priorities and implementation plans for important technologies that may conflict or overlap. These can include business intelligence, event processing, business process management, rules management, network upgrades and new or modified applications and databases.
  • They don’t understand how to create a personalized user experience that enables nontechnical employees in different roles to monitor data or event streams, identify significant changes, quickly understand the correlation between events and develop a context in which to determine the right decisions or actions to take.

Ventana Research has announced new benchmark research on The Internet of Things and Operational Intelligence that will identify trends and best practices associated with this technology and these processes. It will explore organizations’ experiences with initiatives related to events and data and with attempts to align IT projects, resources and spending with new business objectives that demand real-time intelligence and event-driven architectures. The research will investigate how organizations are increasing their responsiveness to events by rebalancing the roles of networks, applications and databases to reduce latency; it also will explore ways in which they are using sensor data and alerts to anticipate problematic events. We will benchmark the performance of organizations’ implementations, including IoT, event stream processing, event and activity monitoring, alerting, event modeling and workflow, and process and rules management.

As operational intelligence evolves as the core of IoT platforms, it is an important time to take a closer look at this emerging opportunity and challenge. For those interested in learning more or becoming involved in this upcoming research, please let me know.

Regards,

Ventana Research

Splunk’s annual gathering, this year called .conf 2015, in late September hosted almost 4,000 Splunk customers, partners and employees. It is one of the fastest-growing user conferences in the technology industry. The area dedicated to Splunk partners has grown from a handful of booths a few years ago to a vast showroom floor many times larger. While the conference’s main announcement was the release of Splunk Enterprise 6.3, its flagship platform, the progress the company is making in the related areas of machine learning and the Internet of Things (IoT) most caught my attention.

Splunk’s strength is its ability to index, normalize, correlate and query data throughout the technology stack, including applications, servers, networks and sensors. It uses distributed search that enables correlation and analysis of events across local- and wide-area networks without moving vast amounts of data. Its architectural approach unifies cloud and on-premises implementations and provides extensibility for developers building applications. Originally, Splunk provided an innovative way to troubleshoot complex technology issues, but over time new uses for Splunk-based data have emerged, including digital marketing analytics, cyber security, fraud prevention and connecting digital devices in the emerging Internet of Things. Ventana Research has covered Splunk since its establishment in the market, most recently in this analysis of mine.

Splunk’s experience in dealing directly with distributed, time-series data and processes on a large scale puts it in position to address the Internet of Things from an industrial perspective. This sort of data is at the heart of large-scale industrial control systems, but it often comes in different formats and its implementation is based on different formats and protocols. For instance, sensor technology and control systems that were invented 10 to 20 years ago use very different technology than modern systems. Furthermore, as with computer technology, there are multiple layers in stack models that have to communicate. Splunk’s tools help engineers and systems analysts cross-reference these disparate systems in the same way that it queries computer system and network data, however, the systems can be vastly different. To address this challenge, Splunk turns to its partners and its extensible platform. For example, Kepware has developed plug-ins that use its more than 150 communication drivers so users can stream real-time industrial sensor and machine data directly into the Splunk platform. Currently, the primary value drivers for organizations in this field of the industrial IoT are operational efficiency, predictive maintenance and asset management. At the conference, Splunk showcased projects in these areas including one with Target that uses Splunk to improve operations in robotics and manufacturing.

For its part, Splunk is taking a multipronged approach by acquiring companies, investing in internal development and enabling its partner ecosystem to build new products. One key enabler of its approach to IoT is machine learning algorithms built on the Splunk platform. In machine learning a model can use new data to continuously learn and adapt its answers to queries. This differs from conventional predictive analytics, in which users build models and validate them based on a particular sample; the model does not adapt over time. With machine learning, for instance, if a piece of equipment or an automobile shows a certain optimal pattern of operation over time, an algorithm can identify that pattern and build a model for how that system should behave. When the equipment begins to act in a less optimal or anomalous way, the system can alert a human operator that there may be a problem, or in a machine-to-machine situation, it can invoke a process to solve the problem or recalibrate the machine.

Machine learning algorithms allow event processes to be audited, analyzed and acted upon in real time. They enable predictive capabilities for maintenance, transportation and logistics, and asset management and can also be applied in more people-oriented domains such as fraud prevention, security, business process improvement, and digital products.  IoT potentially can have a major impact on business processes, but only if organizations can realign systems to discover-and-adapt rather than model-and-apply approaches. For instance, processes are often carried out in an uneven fashion different from the way the model was conceived and communicated through complex process documentation and systems. As more process flows are directly instrumented and more processes carried out by machines, the ability to model directly based on the discovery of those event flows and to adapt to them (through human learning or machine learning) becomes key to improving organizational processes. Such realignment of business processes, however, often involves broad organizational transformation.Our benchmark research on operational intelligence shows that challenges associated with people and processes, rather than information and technology, most often hold back organizational improvement.

Two product announcements made at the conference illuminate the direction Splunk is taking with IoT and machine learning. The first is User Behavior Analytics (UBA), based VR2015_InnovationAwardWinneron its acquisition of Caspida, which produces advanced algorithms that can detect anomalous behavior within a network. Such algorithms can model internal user behavior, and when behavior deviates from the specified norm, it can generate an alert that can be addressed through investigative processes usingSplunk Enterprise Security 4.0. Together, Splunk Enterprise Security 4.0 and UBA won the 2015 Ventana Research CIO Innovation Award.The acquisition of Caspida shows that Splunk is not afraid to acquire companies in niche areas where they can exploit their platform to deliver organizational value. I expect that we will see more such acquisitions of companies with high value ML algorithms as Splunk carves out specific positions in the emergent markets.

The other product announced is IT Service Intelligence (ITSI), which highlights machine learning algorithms alongside of Splunk’s core capabilities. The IT Service Intelligence App is an application in which end users deploy machine learning to see patterns in various IT service scenarios. ITSI can inform and enable multiple business uses such as predictive maintenance, churn analysis, service level agreements and chargebacks. Similar to UBA, it uses anomaly detection to point out issues and enables managers to view highly distributed processes such as claims process data in insurance companies. At this point, however, use of ITSI (like other areas of IoT) may encounter cultural and political issues as organizations deal with changes in the roles of IT and operations management. Splunk’s direction with ITSI shows that the company is staying close to its IT operations knitting as it builds out application software, but such development also puts Splunk into new competitive scenarios where legacy technology and processes may still be considered good enough.

We note that ITSI is built using Splunk’s Machine Learning Toolkit and showcase, which currently is in preview mode. The vr_Big_Data_Analytics_08_top_capabilities_of_big_data_analyticsplatform is an important development for the company and fills one of the gaps that I pointed out in its portfolio last year. Addressing this gap enables Splunk and its partners to create services that apply advanced analytics to big data that almost half (45%) of organizations find important. The use of predictive and advanced analytics on big data I consider a killer application for big data; our benchmark research on big data analytics backs this claim: Predictive analytics is the type of analytics most (64%) organizations wish to pursue on big data.

Organizations currently looking at IoT use cases should consider Splunk’s strategy and tools in the context of specific problems they need to address. Machine learning algorithms built for particular industries are key so it is important to understand if the problem can be addressed using prebuilt applications provided by Splunk or one of its partners, or if the organization will need to build its own algorithms using the Splunk machine learning platform or alternatives. Evaluate both the platform capabilities and the instrumentation, the type of protocols and formats involved and how that data will be consumed into the system and related in a uniform manner. Most of all, be sure the skills and processes in the organization align with the technology from an end user and business perspective.

Regards,

Ventana Research

The concept and implementation of what is called big data are no longer new, and many organizations, especially larger ones, view it as a way to manage and understand the flood of data they receive. Our benchmark research on big data analytics shows that business intelligence (BI) is the most common type of system to which organizations deliver big data. However, BI systems aren’t a good fit for analyzing big data. They were built to provide interactive analysis of structured data sources using Structured Query Language (SQL). Big data includes large volumes of data that does not fit into rows and columns, such as sensor data, text data and Web log data. Such data must be transformed and modeled before it can fit into paradigms such as SQL.

The result is that currently many organizations run separate systems for big data and business intelligence. On one system, conventional BI tools as well as new visual discovery tools act on structured data sources to do fast interactive analysis. In this area analytic databases can use column store approaches and visualization tools as a front end for fast interaction with the data. On other systems, big data is stored in distributed systems such as the Hadoop Distributed File System (HDFS). Tools that use it have been developed to access, process and analyze the data. Commercial distribution companies aligned with the open source Apache Foundation, such as Cloudera, Hortonworks and MapR, have built ecosystems around the MapReduce processing paradigm. MapReduce works well for search-based tasks but not so well for the interactive analytics for which business intelligence systems are known. This situation has created a divide between business technology users, who gravitate to visual discovery tools that provide easily accessible and interactive data exploration, and more technically skilled users of big data tools that require sophisticated access paradigms and elongated query cycles to explore data.

vr_Big_Data_Analytics_07_dissatisfaction_with_big_data_analyticsThere are two challenges with the MapReduce approach. First, working with it is a highly technical endeavor that requires advanced skills. Our big data analytics research shows that lack of skills is the most widespread reason for dissatisfaction with big data analytics, mentioned by more than two-thirds of companies. To fill this gap, vendors of big data technologies should facilitate use of familiar interfaces including query interfaces and programming language interfaces. For example, our research shows that Standard SQL is the most important method for implementing analysis on Hadoop. To deal with this challenge, the distribution companies and others offer SQL abstraction layers on top of HDFS, such as HIVE and Cloudera Impala. Companies that I have written about include Datameer and Platfora, whose systems help users interact with Hadoop data via interactive systems such as spreadsheets and multidimensional cubes. With their familiar interaction paradigms such systems have helped increase adoption of Hadoop and enable more than a few experts to access big data systems.

The second challenge is latency. As a batch process MapReduce must sort and aggregate all of the data before creating analytic output. Technology such as Tez, developed by Hortonworks, and Cloudera Impala aim to address such speed limitations; the first leverages MapReduce, and the other circumvents MapReduce altogether. Adoption of these tools has moved the big data market forward, but challenges remain such as the continuing fragmentation of the Hadoop ecosystem and a lack of standardization in approaches.

An emerging technology holds promise for bridging the gap between big data and BI in a way that can unify big data ecosystems rather than dividing them. Apache Spark, under development since 2010 at the University of California Berkeley’s AMPLab, addresses both usability and performance concerns for big data. It adds flexibility by running on multiple platforms in terms of both clustering (such as Hadoop YARN and Apache Mesos) and distributed storage (for example, HDFS, Cassandra, Amazon S3 and OpenStack’s Swift). Spark also expands the potential uses because the platform includes an SQL abstraction layer (Spark SQL), a machine learning library (MLlib), a graph library (GraphX) and a near-real-time engine (Spark Streaming). Furthermore, Spark can be programmed using modern languages such as Python and Scala. Having all of these components integrated is important because interactive business intelligence, advanced analytics and operational intelligence on big data all can work without dealing with the complexity of having individual proprietary systems that were necessary to do the same things previously.

Because of this potential Spark is becoming a rallying point for providers of big data analytics. It has become the most active Apache project as key open source contributors moved their focus from other Hadoop projects to it. Out of the effort in Berkeley, Databricks was founded for commercial development of open source Apache Spark and has raised more than $46 million. Since the initial release in May 2014 the momentum for Spark has continued to build; major companies have made announcements around Apache Spark. IBM said it will dedicate 3,500 researchers and engineers to develop the platform and help customers deploy it. This is the largest dedicated Spark effort in the industry, akin to the move IBM made in the late 1990s with the Linux open source operating system. Oracle has built Spark into its Big Data Appliance. Microsoft has Spark as an option on its HDInsight big data approach but has also announced Prajna, an alternative approach to Spark. SAP has announced integration with its SAP HANA platform, although it represents “coopetition” for SAP’s in-memory platform. In addition, all the major business intelligence players have built or are building connectors to run on Spark. In time, Spark likely will serve as a data ingestion engine for connecting devices in the Internet of Things (IoT). For instance, Spark can integrate with technologies such as Apache Kafka or Amazon Kinesis to instantly process and analyze IoT data so that immediate action can be taken. In this way, as it is envisioned by its creators, Spark can serve as the nexus of multiple systems.

Because it is a flexible in-memory technology for big data, Spark opens the door to many new opportunities, which in business use include interactive analysis, advanced customer analytics,VentanaResearch_NextGenPredictiveAnalytics_BenchmarkResearchfraud detection, and systems and network management. At the same time, it is not yet a mature technology and for this reason,  organizations considering adoption should tread carefully. While Spark may offer better performance and usability, MapReduce is already widely deployed. For those users, it is likely best to maintain the current approach and not fix what is not broken. For future big data use, however, Spark should be carefully compared to other big data technologies. In this case as well as others, technical skills can still be a concern. Scala, for instance, one of the key languages used with Spark, has little adoption, according to our recent research on next-generation predictive analytics. Manageability is an issue as for any other nascent technology and should be carefully addressed up front. While, as noted, vendor support for Spark is becoming apparent, frequent updates to the platform can mean disruption to systems and processes, so examine the processes for these updates. Be sure that vendor support is tied to meaningful business objectives and outcomes. Spark is an exciting new technology, and for early adopters that wish to move forward with it today, both big opportunities and challenges are in store.

Regards,

Ventana Research

One of the key findings in our latest benchmark research into predictive analytics is that companies are incorporating predictive analytics into their operational systems more often than was the case three years ago. The research found that companies are less inclined to purchase stand-alone predictive analytics tools (29% vs 44% three years ago) and more inclined to purchase predictive analytics built into business intelligence systems (23% vs 20%), applications (12% vs 8%), databases (9% vs 7%) and middleware (9% vs 2%). This trend is not surprising since operationalizing predictive analytics – that is, building predictive analytics directly into business process workflows – improves companies’ ability to gain competitive advantage: those that deploy predictive analyticsvr_NG_Predictive_Analytics_12_frequency_of_updating_predictive_models within business processes are more likely to say they gain competitive advantage and improve revenue through predictive analytics than those that don’t.

In order to understand the shift that is underway, it is important to understand how predictive analytics has historically been executed within organizations. The marketing organization provides a useful example since it is the functional area where organizations most often deploy predictive analytics today. In a typical organization, those doing statistical analysis will export data from various sources into a flat file. (Often IT is responsible for pulling the data from the relational databases and passing it over to the statistician in a flat file format.) Data is cleansed, transformed, and merged so that the analytic data set is in a normalized format. It then is modeled with stand-alone tools and the model is applied to records to yield probability scores. In the case of a churn model, such a probability score represents how likely someone is to defect. For a marketing campaign, a probability score tells the marketer how likely someone is to respond to an offer. These scores are produced for marketers on a periodic basis – usually monthly. Marketers then work on the campaigns informed by these static models and scores until the cycle repeats itself.

The challenge presented by this traditional model is that a lot can happen in a month and the heavy reliance on process and people can hinder the organization’s ability to respond quickly to opportunities and threats. This is particularly true in fast-moving consumer categories such as telecommunications or retail. For instance, if a person visits the company’s cancelation policy web page the instant before he or she picks up the phone to cancel the contract, this customer’s churn score will change dramatically and the action that the call center agent should take will need to change as well. Perhaps, for example, that score change should mean that the person is now routed directly to an agent trained to deal with possible defections. But such operational integration requires that the analytic software be integrated with the call agent software and web tracking software in near-real time.

Similarly, the models themselves need to be constantly updated to deal with the fast pace of change. For instance, if a telecommunications carrier competitor offers a large rebate to customers to switch service providers, an organization’s churn model can be rendered out of date and should be updated. Our research shows that organizations that constantly update their models gain competitive advantage more often than those that only update them periodically (86% vs 60% average), more often show significant improvement in organizational activities and processes (73% vs 44%), and are more often very satisfied with their predictive analytics (57% vs 23%).

Building predictive analytics into business processes is more easily discussed than done; complex business and technical challenges must be addressed. The skills gap that I recently wrote about is a significant barrier to implementing predictive analytics. Making predictive analytics operational requires not only statistical and business skills but technical skills as well.   From a technical perspective, one of the biggest challenges for operationalizing predictive analytics is accessing and preparing data which I wrote about. Four out of ten companies say that this is the part of the predictive analytics process vr_NG_Predictive_Analytics_02_impact_of_doing_more_predictive_analyticswhere they spend the most time. Choosing the right software is another challenge that I wrote about. Making that choice includes identifying the specific integration points with business intelligence systems, applications, database systems, and middleware. These decisions will depend on how people use the various systems and what areas of the organization are looking to operationalize predictive analytics processes.

For those that are willing to take on the challenges of operationalizing predictive analytics the rewards can be significant, including significantly better competitive positioning and new revenue opportunities. Furthermore, once predictive analytics is initially deployed in the organization it snowballs, with more than nine in ten companies going on to increase their use of predictive analytics. Once companies reach that stage, one third of them (32%) say predictive analytics has had a transformational impact and another half (49%) say it provides a significant positive benefits.

Regards,

Ventana Research

Our benchmark research into predictive analytics shows that lack of resources, including budget and skills, is the number-one business barrier to the effective deployment and use of predictive analytics; awareness – that is, an understanding of how to apply predictive analytics to business problems – is second. In order to secure resources and address awareness problems a business case needs to be created and communicated clearly wherever appropriate across the organization. A business case presents the reasoning for initiating a project or task. A compelling business case communicates the nature of the proposed project and the arguments, both quantified and unquantifiable, for its deployment.

The first steps in creating a business case for predictive analytics are to understand the audience and to communicate with the experts who will be involved in leading the project. Predictive analytics can be transformational in nature and therefore the audience potentially is broad, including many disciplines within the organization. Understand who should be involved in business case creation a list that may include business users, analytics users and IT. Those most often primarily responsible for designing and deploying predictive analytics are data scientists (in 31% of organizations), the business intelligence and data warehouse team (27%), those working in general IT (16%) and line of business analysts (13%), so be sure to involve these groups. Understand the specific value and challenges for each of the constituencies so the business case can represent the interests of these key stakeholders. I discuss the aspects of the business where these groups will see predictive analytics most adding value here and here.

For the business case for a predictive analytics deployment to be persuasive, executives also must understand how specifically the deployment will impact their areas of responsibilityvr_NG_Predictive_Analytics_01_front_office_functions_use_predictive_anal.._ and what the return on investment will be. For these stakeholders, the argument should be multifaceted. At a high level, the business case should explain why predictive analytics is important and how it fits with and enhances the organization’s overall business plan. Industry benchmark research and relevant case studies can be used to paint a picture of what predictive analytics can do for marketing (48%), operations (44%) and IT (40%), the functions where predictive analytics is used most.

A business case should show how predictive analytics relates to other relevant innovation and analytic initiatives in the company. For instance, companies have been spending money on big data, cloud and visualization initiatives where software returns can be more difficult to quantify. Our research into big data analytics and data and analytics in the cloud show that the top benefit for these initiatives are communication and knowledge sharing. Fortunately, the business case for predictive analytics can cite the tangible business benefits our research identified, the most often identified of which are achieving competitive advantage (57%), creating new revenue opportunities (50%), and increasing profitability vr_NG_Predictive_Analytics_03_benefits_of_predictive_analytics(46%). But the business case can be made even stronger by noting that predictive analytics can have added value when it is used to leverage other current technology investments. For instance, our big data analytics research shows that the most valuable type of analytics to be applied to big data is predictive analytics.

To craft the specifics of the business case, concisely define the business issue that will be addressed. Assess the current environment and offer a gap analysis to show the difference between the current environment and the future environment). Offer a recommended solution, but also offer alternatives. Detail the specific value propositions associated with the change. Create a financial analysis summarizing costs and benefits. Support the analysis with a timeline including roles and responsibilities. Finally, detail the major risk factors and opportunity costs associated with the project.

For complex initiatives, break the overall project into a series of shorter projects. If the business case is for a project that will involve substantial work, consider providing separate timelines and deliverables for each phase. Doing so will keep stakeholders both informed and engaged during the time it takes to complete the full project. For large predictive analytics projects, it is important to break out the due-diligence phase and try not to make any hard commitments until that phase is completed. After all, it is difficult to establish defensible budgets and timelines until one knows the complete scope of the project.

Ensure that the project time line is realistic and addresses all the key components needed for a successful deployment.  In particular with predictive analytics projects, make certain that it reflects a thoughtful approach to data access, data quality and data preparation. We note that four in 10 organizations say vr_NG_Predictive_Analytics_08_time_spent_in_predictive_analytic_processthat the most time spent in the predictive analytics process is in data preparation and another 22 percent say that they spend the most time accessing data sources. If data issues have not been well thought through, it is next to impossible for the predictive analytics initiative to be successful. Read my recent piece on operationalizing predictive analytics to show how predictive analytics will align with specific business processes.

If you are proposing the implementation of new predictive analytics software, highlight the multiple areas of return beyond competitive advantage and revenue benefits. Specifically, new software can have a total lower cost of ownership and generate direct cost savings from improved operating efficiencies. A software deployment also can yield benefits related to people (productivity, insight, fewer errors), management (creativity, speed of response), process (shorter time on task or time to complete) and information (easier access, more timely, accurate and consistent). Create a comprehensive list of the major benefits the software will provide compared to the existing approach, quantifying the impact wherever possible. Detail all major costs of ownership whether the implementation is on-premises or cloud-based: these will include licensing, maintenance, implementation consulting, internal deployment resources, training, hardware and other infrastructure costs. In other words, think broadly about both the costs and the sources of return in building the case for new technology. Also, read my recent piece on procuring predictive analytics software.

Understanding the audience, painting the vision, crafting the specific case, outlining areas of return, specifying software, noting risk factors, and being as comprehensive as possible are all part of a successful business plan process. Sometimes, the initial phase is really just a pitch for project funding and there won’t be any dollar allocation until people are convinced that the program will get them what they need.  In such situations multiple documents may be required, including a short one- to two-page document that outlines vision and makes a high-level argument for action from the organizational stakeholders. Once a cross functional team and executive support is in place, a more formal assessment and design plan following the principles above will have to be built.

Predictive analytics offers significant returns for organizations willing pursue it, but establishing a solid business case is the first step for any organization.

Regards,

Ventana Research

As I discussed in the state of data and analytics in the cloud recently, usability is a top evaluation criterion for organizations in selecting cloud-based analytics software. Data access of cloud and on-premises systems are essential antecedents of usability. They can help business people perform analytic tasks themselves without having to rely on IT. Some tools allow data integration by business users on an ad hoc basis, but to provide an enterprise integration process and a governed information platform, IT involvement is often necessary. Once that is done, though, using cloud-based data for analytics can help, empowering business users and improving communication and process .

vr_DAC_16_dealing_with_multiple_data_sourcesTo be able to make the best decisions, organizations need access to multiple integrated data sources. The research finds that the most common data sources are predictable: business applications (51%), business intelligence applications (51%), data warehouses or operational data stores (50%), relational databases (41%) and flat files (33%). Increasingly, though, organizations also are including less structured sources such as semistructured documents (33%), social media (27%) and nonrelational database systems (19%). In addition there are important external data sources, including business applications (for 61%), social media data (48%), Internet information (42%), government sources (33%) and market data (29%). Whether stored in the cloud or locally, data must be normalized and combined into a single data set so that analytics can be performed.

Given the distributed nature of data sources as well as the diversity of data types, information platforms and integration approaches are changing. While more than three in five companies (61%) still do integration primarily between on-premises systems, significant percentages are now doing integration from the cloud to on-premises (47%) and from on-premises to the cloud (39%). In the future, this trend will become more pronounced. According to our research, 85 percent of companies eventually will integrate cloud data with on-premises sources, and 84 percent will do the reverse. We expect that hybrid architectures, a mix of on-premises and cloud data infrastructures, will prevail in enterprise information architectures for years to come while slowly evolving to equality of bidirectional data transfer between the two types.

Further analysis shows that a focus on integrating data for cloud analytics can give organizations competitive advantage. Those who said it is very important to integrate data for cloud-based analytics (42% of participants) also said they are very confident in their ability to use the cloud for analytics (35%); that’s three times more often than those who said integrating data is important (10%) or somewhat important (9%). Those saying that integration is very important also said more often that cloud-based analytics helps their customers, partners and employees in an array of ways, including improved presentation of data and analytics (62% vs. 43% of those who said integration is important or somewhat important), gaining access to many different data sources (57% vs. 49%) and improved data quality and data management (59% vs. 53%). These numbers indicate that organizations that neglect the integration aspects of cloud analytics are likely to be at a disadvantage compared to their peers that make it a priority.

Integration for cloud analytics is typically a manual task. In particular, almost half (49%) of organizations in the research use spreadsheets to manage the integration and preparation of cloud-based data. Yet doing so poses serious challenges: 58 percent of those using spreadsheets said it hampers their ability to manage processes efficiently. While traditional methods may suffice for integrating relatively small and well-defined data sets in an on-premises environment, they have limits when dealing with the scale and complexity of cloud-based data. vr_DAC_02_satisfaction_with_data_integration_toolsThe research also finds that organizations utilizing newer integration tools are satisfied with them more often than those using older tools. More than three-fourths (78%) of those using tools provided by a cloud applications  provider said they are satisfied or somewhat satisfied with them, as are even more (86%) of those using data integration tools designed for cloud computing; by comparison, fewer of those using spreadsheets (56%) or traditional enterprise data integration tools (71%) are satisfied.

This is not surprising. Modern cloud connectors are designed to connect via loosely coupled interfaces that allow cloud systems to share data in a flexible manner. The research thus suggests that for organizations needing to integrate data from cloud-based data sources, switching to modern integration tools can streamline the process.

Overall three-quarters of companies in our research said that it is important or very important to access data from cloud-based sources for analysis. Cloud-based analytics isn’t useful unless the right data can be fed into the analytic process. But without capable tools this is not easy to do. A substantial impediment is that analysts spend the majority of their time in accessing and preparing the data rather than in actual analysis. Complicating the task, each data source can represent a different, possibly complex, data model. Furthermore, the data sets may have varying data formats and interface requirements, which are not easily addressed with legacy integration tools.

Such complexity is the new reality, and new tools and approaches have come to market to address these complexities. For organizations looking to integrate their data for cloud-based analytics, we recommend exploring these new integration processes and technologies.

Regards,

Ventana Research

Our recently completed benchmark research on data and analytics in the cloud shows that analytics deployed in cloud-based systems is gaining widespread adoption. Almost half (48%) of vr_DAC_04_widespread_use_of_cloud_based_analyticsparticipating organizations are using cloud-based analytics, another 19 percent said they plan to begin using it within 12 months, and 31 percent said they will begin to use cloud-based analytics but do not know when. Participants in various areas of the organization said they use cloud-based analytics, but front-office functions such as marketing and sales rated it important more often than did finance, accounting and human resources. This front-office focus is underscored by the finding that the categories of information for which cloud-based analytics is most often deemed important are forecasting (mentioned by 51%) and customer-related (47%) and sales-related (33%) information.

The research also shows that while adoption is high, organizations face challenges as they seek to realize full value from their cloud-based data and analytics initiatives. Our Performance Index analysis reveals that only one in seven organizations reach the highest Innovative level of the four levels of performance in their use of cloud-based analytics. Of the four dimensions we use to further analyze performance, organizations do better in Technology and Process than in Information and People. That is, the tools and analytic processes used for data and analytics in the cloud have advanced more rapidly than users’ abilities to work with their information. The weaker performance in People and Information is reflected in findings on the most common barriers to deployment of cloud-based analytics: lack of confidence about the security of data and analytics, mentioned by 56 percent of organizations, and not enough skills to use cloud-based analytics (42%).

Given the top barrier of perceived data security issues, it is not surprising the research finds that the largest percentage of organizations (66%) use a private cloud, which by its nature ostensibly is more secure, to deploy analytics; fewer use a public cloud (38%) or a hybrid cloud (30%), although many use more than one type today. We know from tracking analytics and business intelligence software providers that operate in the public cloud that this is changing quite rapidly. Comparing vr_DAC_06_how_to_deploy_cloud_based_analyticsdeployment by industry sector, the research analysis shows that private and hybrid clouds are more prevalent in the regulated areas of finance, insurance and real estate and government than in services and manufacturing. The research suggests that private and hybrid cloud deployments are used more often for analytics where data privacy is a concern.

Furthermore, organizations said that access to data for analytics is easier with private and hybrid clouds (29% for public cloud vs. 58% for private cloud and 67% for hybrid cloud). In addition, organizations using private and hybrid cloud more often said they have improved communication and information sharing (56% public vs. 72% private and 70% hybrid). Thus, the research data makes clear that organizations feel more comfortable implementing analytics in a private or hybrid cloud in many areas.

Private and hybrid cloud implementations of data and analytics often coincide with large data integration efforts, which are necessary at some point to benefit from such deployments. Those who said that integration is very important also said more often than those giving it less importance that cloud-based analytics helps their customers, partners and employees in an array of ways, including improved presentation of data and analytics (62% vs. 43% of those who said integration is important or somewhat important), gaining access to many different data sources (57% vs. 49%) and improved data quality and data management (59% vs. 53%). We note that the focus on data integration efforts correlates more with private and hybrid cloud approaches than with public cloud approaches, thus the benefits cannot be directly assigned to the various cloud approaches nor the integration efforts.

Another key insight from the research is that data and analytics often are considered in conjunction with mobile and collaboration initiatives which have different priorities for business than IT or in consumer markets. Nine out of 10 organizations said they use or intend to use collaboration technology to support their cloud-based data and analytics, and 83 percent said they need to support data access and analytics on mobile devices. Two-thirds said they support both tablets and smartphones and multiple mobile operating systems, the most important of which are Apple iOS (ranked first by 60%), Google Android (ranked first by 26%) and Microsoft Windows Mobile (ranked first by 13%). We note that Microsoft has a higher percentage of importance here than its reported market share (approximately 2.5%) would suggest. Similarly, Google Android has greater penetration than Apple in the consumer market (51% vs. 41%). We expect that the influence of mobile operating systems related to data and analytics in the cloud will continue to evolve and be impacted by upcoming corporate technology refreshment cycles, the consolidation of PCs and mobile devices, and the “bring your own device” (BYOD) trend.

The research finds that usability (63%) and reliability (57%) arevr_DAC_20_evaluation_criteria_for_cloud_based_analytics the top technology buying criteria, which is consistent with our business technology innovation research conducted last year. What has changed is that manageability is cited as very important as often as functionality, by approximately half of respondents, a stronger showing than in our previous research.  We think it likely that manageability is gaining prominence as cloud providers and organizations sort out issues in who manages deployments along with usage and licensing, along with who actually owns your data in the cloud which my colleague Robert Kugel has discussed.

As the research shows, the importance of cloud data and analytics is continuing to grow. The importance of this topic makes me eager to discuss further the attitudes, re­quire­­ments and future plans of organizations that use data and analytics in the cloud and to identify the best prac­tices of those that are most proficient in it. For more information on this topic, and learn more on best practices for data and analytics in the cloud, and download the executive summary of the report to improve your readiness.

Regards,

Ventana Research

RSS Tony Cosentino’s Analyst Perspectives at Ventana Research

  • An error has occurred; the feed is probably down. Try again later.

Stats

  • 75,473 hits